Researchers have found an unknown wealth of trees in an African desert zone supposedly too arid for green growth.
By Tim Radford, Climate News Network (CC BY-ND 4.0)
With help from high resolution satellite imagery and some advanced artificial intelligence techniques, European scientists have been counting the trees in a parched African desert.
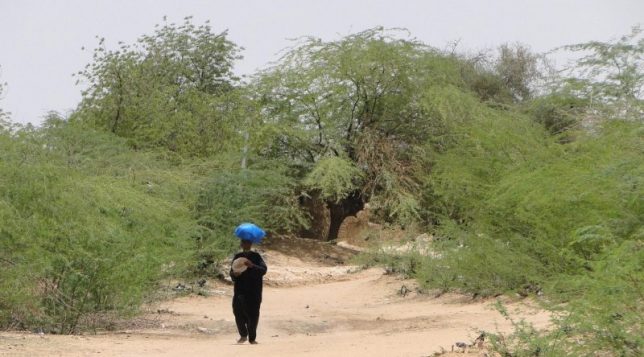
They pored over 1.3 million square kilometres of the waterless western Sahara and the arid lands of the Sahel to the south, to identify what is in effect an unknown forest. This region − a stretch of dunes and dryland larger than Angola, or Peru, or Niger − proved to be home to 1.8 billion trees and shrubs with crowns larger than three square metres.
“We were very surprised to see that quite a few trees actually grow in the Sahara Desert because up till now, most people thought that virtually none existed. We counted hundreds of millions of trees in the desert alone,” said Martin Brandt, a geographer at the University of Copenhagen in Denmark, who led the research.
He and colleagues from Germany, France, Senegal, Belgium and Nasa in the US report in the journal Nature that they used an artificial intelligence technique called “deep learning” and satellite imagery so advanced that − from space − a camera could resolve an object half a metre or more in diameter, to see if they could answer unresolved questions about all those trees beyond the world’s forests.
Trees outside of forested areas are not usually included in climate models, and we know very little about their carbon stocks. They are an unknown component in the global carbon cycle”.
—Martin Brandt, lead researcher, University of Copenhagen
Trees matter, wherever they are. In cities, they enhance urban life and sustain property values. In forests, they conserve and recycle water, shelter millions of animals and smaller plants, and absorb atmospheric carbon. In grasslands they conserve soils, offer habitat for species and provide subsistence fuel, food and fodder for humans and animals.
But trees beyond the forests are an unknown factor when it comes to the puzzle of the global carbon budget and the great challenge of containing runaway climate change.
“Trees outside of forested areas are not usually included in climate models, and we know very little about their carbon stocks,” Dr Brandt said. “They are basically a white spot on maps and an unknown component in the global carbon cycle.”
The total identified in the target zone of the Sahara and the Sahel is almost certainly an under-estimate: the technology did not and could not pinpoint trees with a crown or shade area smaller than 3 square metres.
The study adds to the chronicle of surprises delivered by tree and forest research. In the last few years scientists have essayed a global census of woody growths wider than 5cms at breast height − that’s the botanist’s definition of a tree − and arrived at a total of more than 3 trillion.
New map possible
They have also counted the different kinds of tree: more than 60,000 species. They have already made attempts to measure the extent of tree cover in dryland and savannah regions and identified a kind of hidden forest.
They have calculated that a determined global tree planting campaign could absorb enough carbon to make a formidable difference to the challenge of global heating, and they have confirmed that conserved natural forests are, even on the simple basis of human economics, a bargain: forests are worth more to the world when they flourish than when they are cleared.
The new approach − the match of artificial intelligence with high resolution imagery − could one day help identify not just trees, but different tree species. It could, researchers hope, eventually even provide a reliable count of trees in a forest, although where canopies overlap it will always be difficult to number the trunks that support them. It offers the world’s forest scientists a new starting point for a map of all the planet’s trees.
“Doing so wouldn’t have been possible without this technology,” Dr Brandt said. “Indeed, I think it marks the beginning of a new scientific era.”
Original publication: Climate News Network — LONDON, 27 October, 2020