World Makes Haste Too Slowly on Cutting Energy Use

The annual report card on the global energy industry says progress towards lower energy use must be much faster.

By Kieran Cooke, Climate News Network (CC BY-ND 4.0).

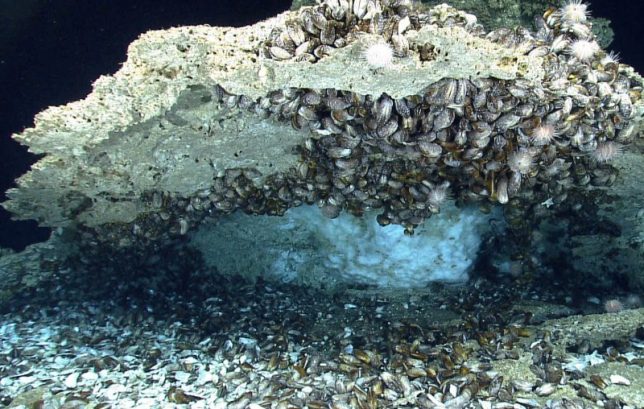
A rich source of methane: Gas hydrate beneath a rock in the Gulf of Mexico. Image: By US Geological Survey (public domain), via Wikimedia Commons

The world is dragging its feet on efforts to tackle the climate crisis by reducing its energy use, according to a global watchdog.

In its World Energy Outlook 2020, the lnternational Energy Agency (IEA) says that while emissions of carbon dioxide (CO2, the main climate-changing greenhouse gas), are falling, the reduction needs to be far steeper to make any meaningful impact.

“Despite a record drop in global emissions this year, the world is far from doing enough to put them into decisive decline”, says Fatih Birol, the IEA’s executive director.

The Agency says energy demand is set to drop by 5% in 2020, with an overall decline of 7% in emissions of CO2 from the global energy sector. This means that annual emissions of CO2 are back to where they were a decade ago, the report says.

Oil demand this year is likely to be down by 8%, while coal use will fall by 7%.

Solar projects now offer some of the lowest-cost electricity ever seen.”

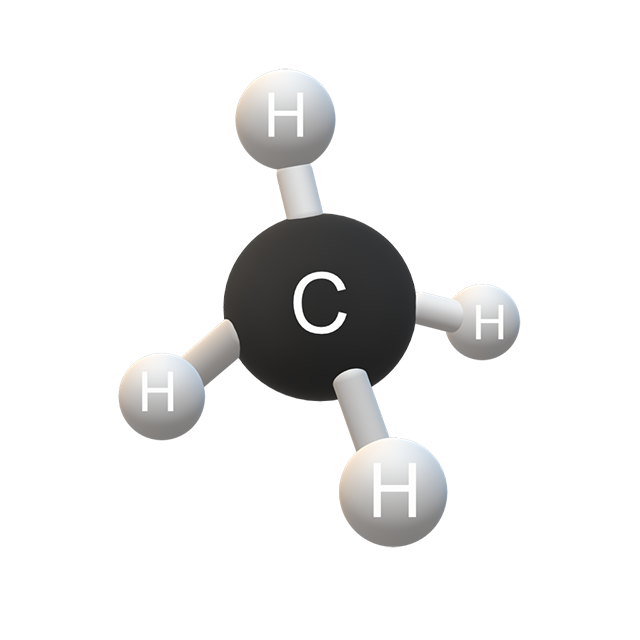
That’s the headline good news: the bad news is that emissions of methane – among the most potent of greenhouse gases – are rising, says the report.

Total global investment in the energy sector is also falling dramatically, and is set to be down 18% year on year.

That means that despite the rise of renewable energy, particularly of solar power, governments, utilities and corporations around the world are still not spending enough to bring about a major transition in energy use – and to meet the challenge of catastrophic climate change.

“Only an acceleration in structural changes to the way the world produces and consumes energy can break the emissions trend for good”, says the IEA.

Problem grids

While hydropower is still the leading source of renewable power, solar is described as the new king of electricity.

“With sharp cost reductions over the past decade, solar PV [solar photovoltaic energy] is consistently cheaper than new coal- or gas-fired power plants in most countries, and solar projects now offer some of the lowest-cost electricity ever seen.”

A major problem is that as solar and wind projects are installed and expanded, other parts of the energy sector also need to be developed, particularly infrastructure associated with electricity grids.

In many parts of the world energy utilities are in severe financial straits and have little or no money to maintain or invest in achieving more efficiencies and in infrastructure.

“Electricity grids could prove to be the weak link in the transformation of the power sector, with implications for the reliability and security of electricity supply”, says the IEA.

Covid-19’s effects

The report says it’s not just the energy industry that has to change. “To reach net-zero emissions, governments, energy companies, investors and citizens all need to be on board – and will all have unprecedented contributions to make.”

The Covid crisis is a major factor in assessing the global energy outlook.

The pandemic, says the IEA, has caused more disruption in the energy sector than any other event in recent history, with impacts for years to come.

“It is too soon to say whether today’s crisis represents a setback for efforts to bring about a more secure and sustainable energy system, or a catalyst that accelerates the pace of change”, the report says. —Climate News Network, LONDON, 16 October, 2020

Arctic heating races ahead of worst-case estimates

Arctic heating is happening far faster than anybody had anticipated. And the ice record suggests this has happened before.

September 2, 2020 by Tim Radford, Climate News Network (CC BY-ND 4.0)

Svalbard, in whose waters temperatures have risen at 1.5°C every decade for the last 40 years. Image: By Vince Gx on Unsplash
Svalbard, in whose waters temperatures have risen at 1.5°C every decade for the last 40 years. Image: By Vince Gx on Unsplash

LONDON, 2 September, 2020 – An international team of scientists brings bad news about Arctic heating: the polar ocean is warming not only faster than anybody predicted, it is getting hotter at a rate faster than even the worst case climate scenario predictions have so far foreseen.

Such dramatic rises in Arctic temperatures have been recorded before, but only during the last Ice Age. Evidence from the Greenland ice cores suggests that temperatures rose by 10°C or even 12°C, over a period of between 40 years and a century, between 120,000 years and 11,000 years ago.

“We have been clearly underestimating the rate of temperature increases in the atmosphere nearest to the sea level, which has ultimately caused sea ice to disappear faster than we had anticipated,” said Jens Hesselbjerg Christensen, a physicist at the University of Copenhagen in Denmark, one of 16 scientists who report in the journal Nature Climate Change on a new analysis of 40 years of data from the Arctic region.

They found that, on average, the Arctic has been warming at the rate of 1°C per decade for the last four decades. Around Norway’s Svalbard archipelago, temperatures rose even faster, at 1.5°C every 10 years.

We have been clearly underestimating the rate of temperature increases in the atmosphere nearest to the sea level, which has ultimately caused sea ice to disappear faster than we had anticipated.”

—Jens Hesselbjerg Christensen, Physicist, University of Copenhagen

During the last two centuries, as atmospheric levels of carbon dioxide climbed from an average of around 285 parts per million to more than 400ppm, so the global average temperature of the planet rose: by a fraction more than 1°C.

The latest study is a reminder that temperatures in the Arctic are rising far faster than that. And the news is hardly a shock: within the past few weeks, separate teams of researchers, reporting to other journals, have warned that Greenland – the biggest single reservoir of ice in the northern hemisphere – is melting faster than ever; more alarmingly, its icecap is losing mass at a rate that suggests the loss could become irreversible.

Researchers have also confirmed that the average planetary temperature  continues to rise inexorably, that the Arctic Ocean could be free of ice in  summer as early as 2035, and that the climate scientists’ “worst case” scenarios are no longer to be regarded as a warning of what could happen: the evidence is that what is happening now already matches the climate forecaster’s worst case. The latest finding implicitly and explicitly supports this flurry of ominous observation.

“We have looked at the climate models analysed and assessed by the UN Climate Panel,” said Professor Christensen. “Only those models based on the worst case scenario, with the highest carbon dioxide emissions, come close to what our temperature measurements show over the past 40 years, from 1979 to today.” – Climate News Network

Reshaping Earth In Profound, Unsustainable Ways

In 2016, the world moved permanently above 400 parts per million. The 400 ppm milestone is a symbolic and necessary reminder that we, as humans, are reshaping Earth in profound and unsustainable ways.

The Keeling Curve, named for scientist Charles David Keeling, is a graph that shows the accumulation of carbon dioxide in the Earth’s atmosphere based on continuous measurements taken at the Mauna Loa Observatory in Hawaii. Keeling’s measurements showed the first significant evidence of rapidly increasing carbon dioxide (CO2) levels in the atmosphere.

NASA, with its carbon monitoring system, shows the amount of CO2 in the atmosphere decreases in the spring and summer. In spring and summer, plants in the oceans and on land pull carbon dioxide out of the atmosphere. In the fall and winter, CO2 increases because plants and animals release the carbon dioxide that captured during the growing season.

Since the Industrial Revolution, we’ve been burning fossil fuels (coal, oil, or natural gas) for energy. Fuels release into the atmosphere significantly faster than the plants in the oceans and on the land can take out the CO2. This is moving the Keeling curve up.