
One option the U.S. and other nations have for ratcheting up pressure on Russia in response to its invasion of Ukraine is reducing their Russian energy purchases. U.K. Foreign Minister Liz Truss has proposed that the G7 nations – the U.S., U.K., Canada, France, Germany, Italy and Japan – impose limits on their Russian oil and gas imports. Global energy policy expert Amy Myers Jaffe explains how this strategy might work and how it could affect international oil markets, which have already been roiled by the conflict.
By Amy Myers Jaffe, The Conversation US, Inc. (CC BY-ND 4.0).
How important is Russia as a global oil supplier?
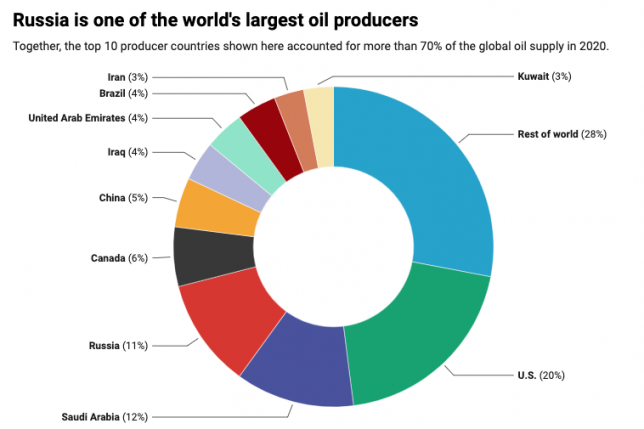
Russia produces close to 11 million barrels per day of crude oil. It uses roughly half of this output for its own internal demand, which presumably has increased due to higher military fuel requirements, and exports 5 million to 6 million barrels per day. Today Russia is the second-largest crude oil producer in the world, behind the U.S. and ahead of Saudi Arabia, but sometimes that order shifts.
About half of Russia’s exported oil – roughly 2.5 million barrels per day – is shipped to European countries, including Germany, Italy, the Netherlands, Poland, Finland, Lithuania, Greece, Romania and Bulgaria. Nearly one-third of it arrives in Europe via the Druzhba Pipeline through Belarus. These 700,000 barrels per day in pipeline shipments would be an obvious target for some kind of sanctions, either by banning financial payments or refusing deliveries via spur lines at the Belarus border.
In 2019, European stopped accepting deliveries for several months from the Druzhba line when crude oil flowing through it became contaminated with organic chlorides that could have damaged oil refineries during processing. Russia’s oil shipments fell noticeably as it redirected flows to avoid the Druzhba line.
The remaining export shipments of Russian crude oil to Europe come mainly by ship from various ports.
China is another large buyer: It imports 1.6 million barrels per day of Russian crude oil. Half comes via a special direct pipeline, the Eastern Siberia Pacific Ocean pipeline, which also services other customers via a port at its end point, including Japan and South Korea.
Time to do more than just playing at the margins. Ban all imports of Russian oil. 🇺🇦 🇨🇦 🇺🇸
— Sonya Savage (@sonyasavage) February 27, 2022
Statement below is from Ukraine’s Foreign Minister ⏬ https://t.co/Vljo1JYcTG
How would Russia be affected if other nations reduce imports of its oil?
Sanctions against Russia’s oil industry would have a greater impact than limiting natural gas flows because Russia’s oil receipts are higher and more critical to its state budget. Russia earned over US$110 billion in 2021 from oil exports, twice as much as its earnings from natural gas sales abroad.
Since oil is a relatively fungible global commodity, much of Russia’s crude exports to Europe and other participating G-7 countries might wind up being sent somewhere else. That would free up other supplies from sources such as Norway and Saudi Arabia to be redirected back to Europe.
Russia’s oil has high sulfur and other impurities, so refining it requires specialized equipment – it can’t be sold just anywhere. But other Asian buyers can take it, including India and Thailand. And Russia has special supply arrangements with countries like Cuba and Venezuela.
It’s already clear, though, that Russia is having trouble redirecting its crude oil sales. At the start of the invasion of Ukraine, European refiners began shunning spot cargoes for fears that sanctions might be forthcoming.
India bought Russian crude cargoes that were already at sea, at a sharp discount. Markets would likely respond to a G-7 oil ceiling by further discounting Russian crude. We saw the same pattern in the past when countries sanctioned Venezuelan and Iranian oil: Those nations still found buyers, but at reduced prices.
Can European nations get oil from other sources?
Oil shipments are arguably easier to reroute than natural gas, which has to be super-chilled to liquefy it for ship transport, then converted back to gas at its destination port. That means Russia’s crude oil may potentially be easier for European countries to replace and reroute than its natural gas, which relies more heavily on pipeline delivery, depending on market conditions.
To ensure replacement barrels are available, Europe and the U.S. could simultaneously increase crude oil sales from their national strategic stocks to lessen the blow of any restrictions on Russian crude oil imports to the G-7. The U.S. is already selling 1.3 million barrels per day from its Strategic Petroleum Reserve, and it could increase these flows. China has also released oil from its national strategic stocks to help ease oil prices.
The U.S. and other G-7 members would also likely ask Middle East countries to relax destination restrictions on their crude oil shipments and press countries like China and India to redirect other oils of similar quality to Russian oil back to Europe if and when they increase their purchases from Moscow. Such steps would lower the chances of G-7 restrictions on Russian oil imports raising global prices.
It’s not certain that China and India would cooperate, but it would be in their interests to do so. They are major oil importers and would not want to see higher crude oil prices.
How would global oil prices be affected if G-7 nations buy less Russian oil?
It would depend on what other steps governments take in response to rerouting of Russian oil exports. Nations are already acting to prepare global markets for shifts in liquefied natural gas flows in case of reduced purchases from Russia.
G-7 energy diplomacy is likely to involve other oil capitals that might be willing to export more oil to alleviate disruption of crude oil sales from Russia. Most exporters are maxed out in terms of crude oil production, but a few of the largest Middle East producers could surge their output in the short term to put an extra 1 million barrels per day or more onto the market.
U.S.-Saudi relations could face a test. Riyadh has access to large stores of crude oil in its vast global tank system and its tankers that float at sea. In 2014, when Russia invaded Crimea, U.S. allies in the Persian Gulf held over 70 million barrels in storage near Fujairah in the United Arab Emirates. They did this as a threat to Russia that a price war would ensue if Russian troops moved beyond that peninsula. Russia stayed in Crimea, so the oil was not released.
Saudi Arabia has instituted price wars that hurt Russia’s economy in 1986, 1998, 2009 and again briefly in 2020. But today’s oil market conditions make a price war an unlikely outcome, given the existing tight balance between supply and demand. The only scenario that could trigger a price war now would be if global demand were to contract suddenly because of a recession.