Why the World’s Peatlands are Key to Stopping Climate Change

Montane Peatland, Polblue Swamp, Barrington Tops National Park by Doug Beckers (CC BY-SA 2.0).

By Gustaf Hugelius, Senior Lecturer, Physical Geography, Stockholm University, World Economic Forum published in collaboration with The Conversation (Public License).

  • Peatlands count for just a few percent of the world’s land, but crucially store almost one-quarter of soil carbon.
  • They play a vital role in regulating the climate, but they’re under threat.
  • A new study from Stockholm University has shown that rising temperatures will mean peatlands will soon start emitting more carbon than they store.
  • Researchers found that by limiting global warming, the worst could be avoided.

Peatlands cover just a few percent of the global land area but they store almost one-quarter of all soil carbon and so play a crucial role in regulating the climate. My colleagues and I have just produced the most accurate map yet of the world’s peatlands – their depth, and how much greenhouse gas they have stored. We found that global warming will soon mean that these peatlands start emitting more carbon than they store.

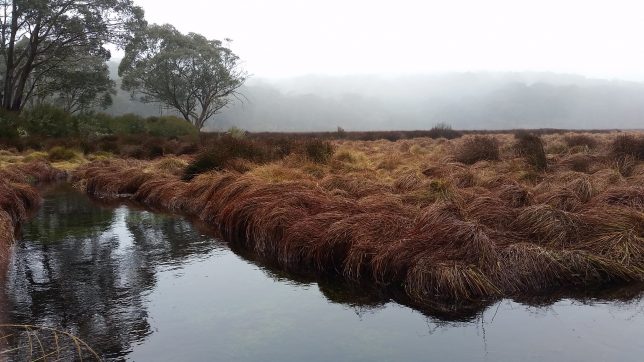
Peatlands form in areas where waterlogged conditions slow down the decomposition of plant material and peat accumulates. This accumulation of carbon-rich plant remains has been especially strong in northern tundra and taiga areas where they have helped cool the global climate for more than 10,000 years. Now, large areas of perennially frozen (permafrost) peatlands are thawing, causing them to rapidly release the freeze-locked carbon back into the atmosphere as carbon dioxide and methane.

Geoscientists have studied peatlands for a long time. They’ve looked at why some areas have peat but others don’t and they’ve looked at how peatlands work as natural archives through which we can reconstruct what the climate and vegetation was like in the past (or even what human life was life: many well-preserved ancient humans have been found in peat bogs).

Scientists have also long recognised that peatlands are important parts of the global carbon cycle and the climate. When plants grow they absorb CO₂ from the atmosphere and as this material accumulates in the peat, there is less carbon in the atmosphere and therefore the climate will cool in the long-term.

With all this knowledge about how important northern peatlands are, it is perhaps surprising to learn that, until recently, there was no comprehensive map of their depth and how much carbon they store. That is why I led an international group of researchers who put together such a map, which we can use to estimate how the peatlands will respond to global warming. Our work is now published in the journal PNAS.

Peatland data and properties north of 23°N latitude. (A) Estimated areal coverage (in percentage) of peatlands based on the national soil inventory maps and SoilGrids250m. (B) Estimated areal coverage (in percentage) of permafrost in mapped peatlands based on the national soil inventory maps and SoilGrids250m, including a maximum threshold for permafrost at MAAT +1 °C (use the same legend as in A). (C) Spatial distribution of peat core sites with peat depth data (n = 7,111) and peat organic C storage (n = 782) over a map of biome distributions (biomes adapted from ref. 32). Sites with peat N stock data (n = 105) are not shown in the map (see Dataset S6), but are predominantly located in boreal forest and tundra biomes. (D) Sites with peat organic C storage data, with the size of site symbols proportional to measured peat organic C storage, over a map of permafrost zonation (33). (E) Estimated total peatland C storage and (F) permafrost peatland C storage.
Peatland data and properties north of 23°N latitude. (A) Estimated areal coverage (in percentage) of peatlands based on the national soil inventory maps and SoilGrids250m. (B) Estimated areal coverage (in percentage) of permafrost in mapped peatlands based on the national soil inventory maps and SoilGrids250m, including a maximum threshold for permafrost at MAAT +1 °C (use the same legend as in A). (C) Spatial distribution of peat core sites with peat depth data (n = 7,111) and peat organic C storage (n = 782) over a map of biome distributions (biomes adapted from ref. 32). Sites with peat N stock data (n = 105) are not shown in the map (see Dataset S6), but are predominantly located in boreal forest and tundra biomes. (D) Sites with peat organic C storage data, with the size of site symbols proportional to measured peat organic C storage, over a map of permafrost zonation (33). (E) Estimated total peatland C storage and (F) permafrost peatland C storage. Source: Gustaf Hugelius, et al., PNAS (CC BY 4.0).

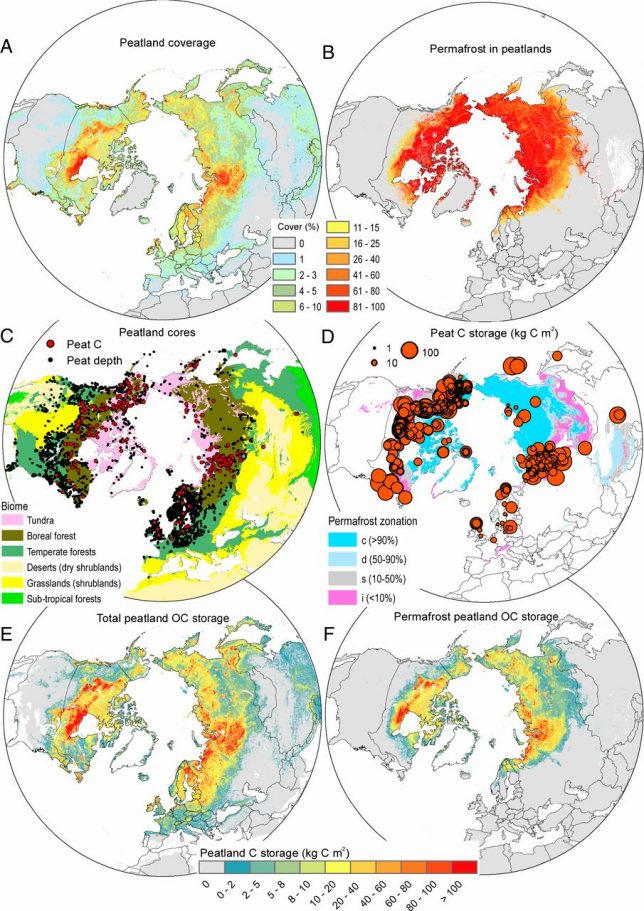
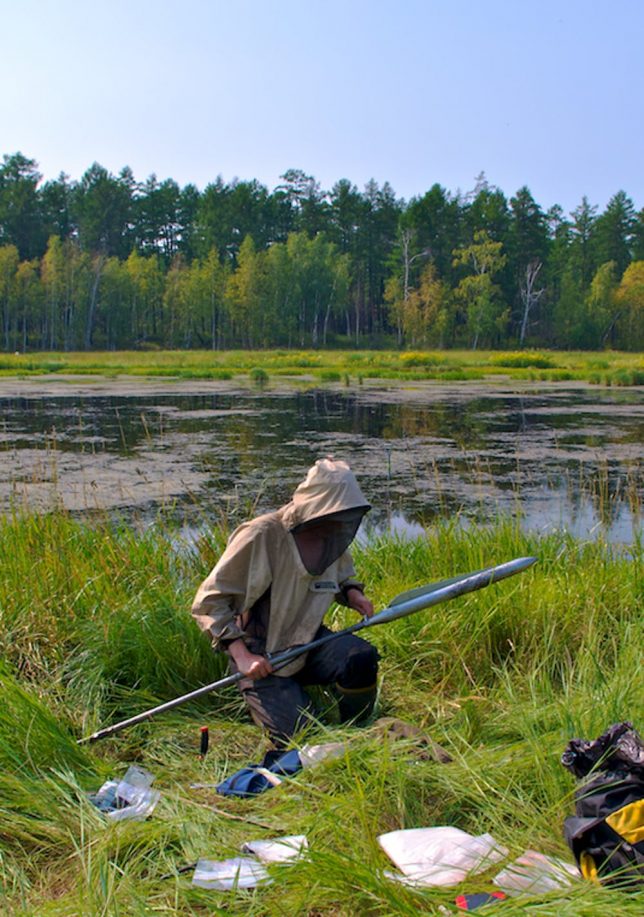
Peatlands are surprisingly difficult to map as their growth is connected to many different local factors, such as how water drains in the landscape. This meant we had to gather more than 7,000 field observations and use new statistical models based on machine learning to create the maps.

We found that peatlands cover approximately 3.7 million square kilometres. If it were a country, “Peatland” would be slightly larger than India. These peatlands also store approximately 415 gigatons (billion tons) of carbon – as much as is stored in all the world’s forests and trees together.

Almost half of this northern peatland carbon is presently in permafrost, ground that is frozen all year round. But, as the world warms and permafrost thaws, it causes peatlands to collapse and completely changes how they relate to greenhouse gases. Areas that once cooled the atmosphere by storing carbon would instead release more of both CO₂ and methane than they stored. We found that the thaw projected from future global warming will cause releases of greenhouse gas that overshadow and reverse the carbon dioxide sink of all northern peatlands for several hundred years. The exact timing of this switch is still highly uncertain, but it is likely to happen in the later half of this century.

There are regions of very extensive permafrost peatlands in Western Siberia and around Hudson Bay in Canada. These unique environments and ecosystems will be fundamentally changed as the permafrost thaws, and their characteristic mix of frozen peat mounds and small lakes will be replaced by extensive areas of wet fens.

Sampling peatland in Siberia. Gustaf Hugelius, Author provided.

These changes will cause more CO₂ and methane to be released into the atmosphere as the previously frozen peat becomes available for microbes that degrade it. The thaw will also lead to large losses of peat into rivers and streams, which will influence both the food chains and biochemistry of inland waters and the Arctic Ocean.

These new finding further reinforce how urgent it is to rapidly reduce our emissions, as the only way to stop permafrost thaw is to limit global warming. There are no geoengineering solutions that can be deployed in these vast and remote areas. Our results clearly show that more limited global warming of 1.5℃-2℃ would be much less damaging than our current trajectories of 3℃-4℃ degrees or above.

Methane in the Climate System: Monitoring Emissions from Satellites

The climate forcing from methane emissions since pre-industrial times has been 60% of that from CO2, meaning that methane has made a large contribution to observed warming over the past century. However, the climate impact of methane emissions is very different than that of CO2 emissions in terms of time scales, and this must be recognized when setting climate policy targets: use of a single climate metric to compare the effects of methane and CO2 emissions is not appropriate. An additional complication is that methane is emitted by a variety of sources, and there is large uncertainty in the contribution of different source regions and sectors to the overall methane budget. The recent decadal uptick in methane has generated much interest and is still unexplained. Satellites offer considerable potential for global monitoring of methane emissions, quantifying the contributions from different sources, detecting temporal variability, and attributing long-term trends. Atmospheric methane has been measured continuously from space since 2003, and new instruments have been recently launched or are planned for launch in the near future that will greatly expand the capabilities of space-based observations. I will discuss the value of these observations to better quantify and monitor methane emissions, from the global scale down to the scale of point sources.

Daniel J. Jacob is the Vasco McCoy Family Professor of Atmospheric Chemistry and Environmental Engineering in the School of Engineering & Applied Science at Harvard University. He received his B.S. (1981) in Chemical Engineering from the Ecole Supérieure de Physique et Chimie Industrielles (ESPCI), and his Ph.D. (1985) in Environmental Engineering from Caltech. He went to Harvard as a postdoc in 1985 and joined the faculty in 1987. His research covers a range of topics in atmospheric chemistry. He has led the development of the GEOS-Chem global 3-D model of atmospheric composition, has served as Mission Scientist on eight NASA aircraft missions, and is a member of several satellite Science Teams. Among his professional honors are the AGU Charney Lecture (2016), the ECMWF Fellowship (2016), the NASA Distinguished Public Service Medal (2003), the AGU Macelwane Medal (1994) and the Packard Fellowship for Science and Engineering (1989). Jacob has published about 400 papers (H-Factor of 110 according to Web of Science) and trained over 90 Ph.D. students and postdocs over the course of his career. When not doing science he likes to hang out in the White Mountains of New Hampshire or at his family estate in Brittany.