
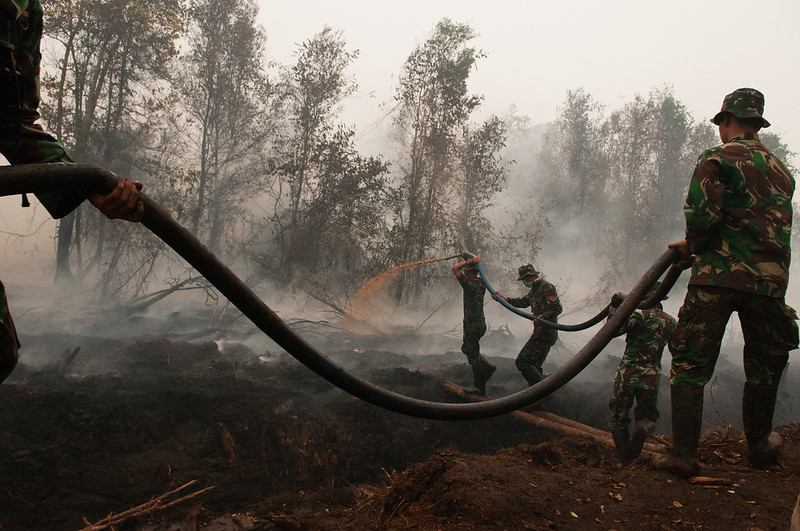
Military might. Army officers try to extinguish fires in peat land areas, outside Palangka Raya, Central Kalimantan. Photo by Aulia Erlangga/CIFOR.
Aalto University researchers have developed a neural network model that can predict peatland fires in Central Kalimantan, Indonesia. The model performs consistently well, with ranges about the medium values of 95% for accuracy, and 78% for precision.
FireCNN, First-Ever Model Capable of Predicting Future Fire Locations
The researchers developed ‘FireCNN’, the first-ever model that can accurately predict the locations of future fires. FireCNN uses a type of machine learning algorithm called CNN (convolutional neural network) to analyze various factors that can predict fire occurrences (e.g., weather conditions, land use) before the start of fire season. The model allows researchers to test how different land management and restoration strategies, such as blocking canals, reforestation, and converting land to plantations, might impact the number of fires in the future without any bias. Researchers also simulated the effects of ongoing deforestation, converting swamp forests into degraded scrublands and plantations, to understand its potential impact on future fires.
The Focus of the Research
Indonesian peatlands face recurrent fires due to human-induced degradation, increasing recurrent fires since the late 1990s. These fires release CO2, equivalent to 30% of global fossil fuel emissions in 2020, and negatively impact the environment, economy, public health, agriculture, and social structure. In 2015, this resulted in a loss of over $16 billion to the Indonesian economy. Despite prohibitions, most ignitions are anthropogenic, started for agricultural expansion.
The investigation focused on the ex-Mega Rice Project (EMRP) area in central Kalimantan, Borneo, which has the highest density of peatland fires in Southeast Asia, recurring since 1997 due to logging, oil palm plantation development, and a failed rice cultivation scheme. This scheme inadvertently transformed swamp forests into degraded peatlands by digging 4000 km of drainage canals and clearing 1 million hectares of swamp forest. The area has distinct dry and wet seasons but a consistent mean monthly temperature of 28°C. Fire season hotspots peak around 11,000 but vary significantly yearly.
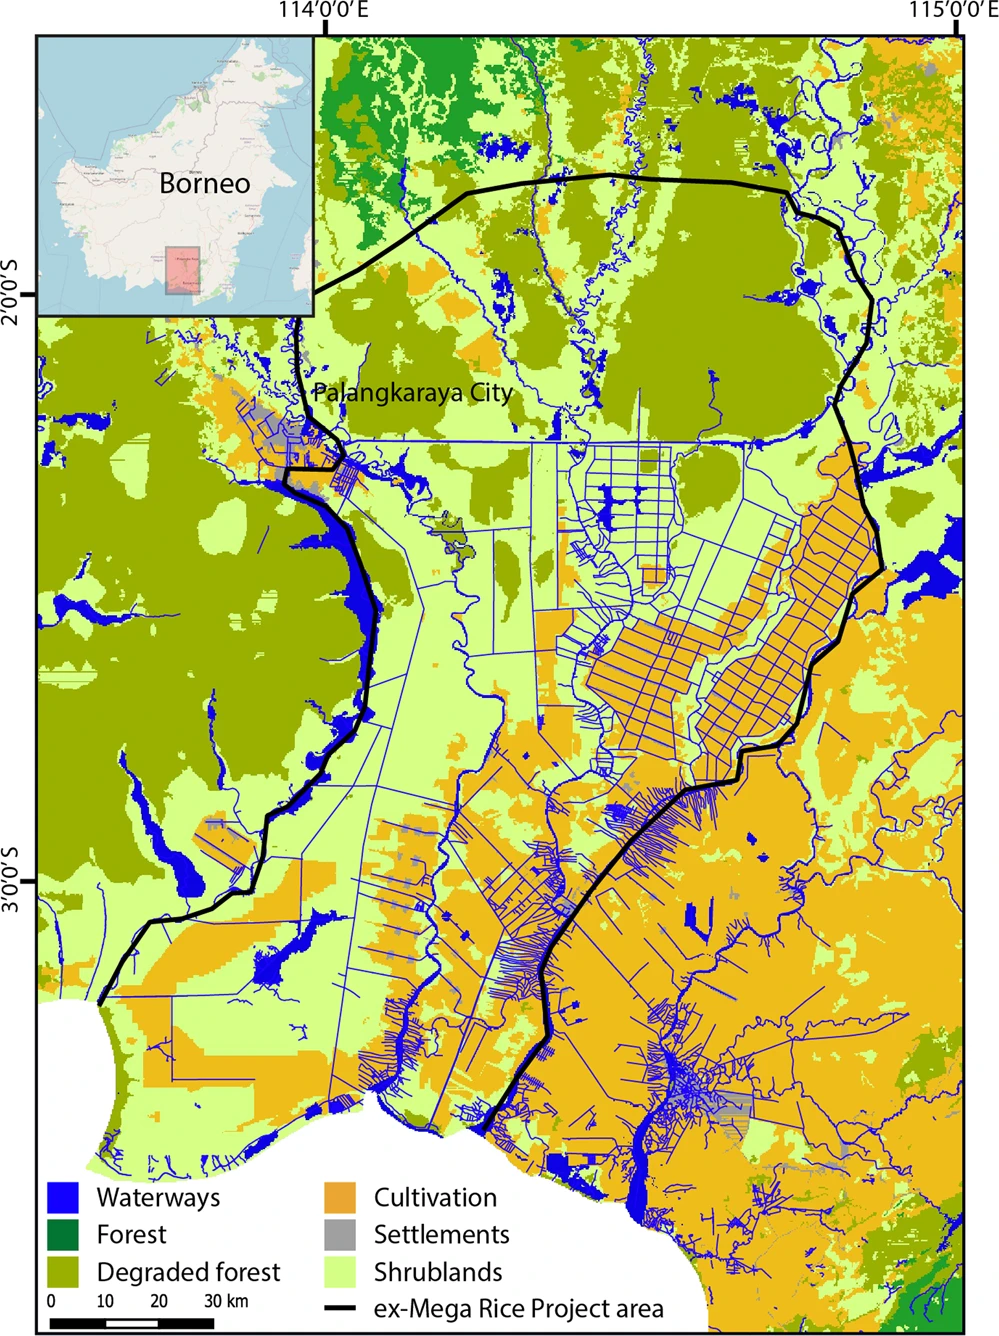
Study area map. Land cover map showing the whole study area (edge of map) circa 2015 as well as the ex-Mega Rice Project (EMRP) area (black outline). Inset map of Borneo provided by OpenStreetMap. Horton, A.J., Lehtinen, J. & Kummu, M. Targeted land management strategies could halve peatland fire occurrences in Central Kalimantan, Indonesia. Commun Earth Environ 3, 204 (2022).
Researchers found that converting degraded swamp shrubland to swamp forest or plantations could reduce fire occurrences by 40-55%. Blocking most canals could reduce fire occurrences by 70%. Effective strategies can reduce carbon emissions and enable sustainable ecosystem management.
Reducing peatland fires is essential for global carbon emission reduction, economic productivity, biodiversity safeguarding, and protecting vulnerable communities. However, efforts in Central Kalimantan have been unsuccessful due to corruption, poor governance, and lack of accountability. Previous studies lacked clear links between restoration efforts and future fire reductions.
Hope for the Development of an Early-Warning System
The findings demonstrate the potential impacts of future peatland restoration efforts, providing much-needed evidence for the potential success of these strategies, which may benefit similar projects currently underway. Postdoctoral researcher Alexander Horton noted that while the methodology could apply to other contexts, the model would need retraining on new data. Researchers hope to improve the model’s performance to serve as an early-warning system.
We tried to quantify how the different strategies would work. It’s more about informing policy-makers than providing direct solutions.
—Professor Matti Kummu, study team’s leader