How Cutting Down Tropical Forests is Costing Lives Through Deadly Heat

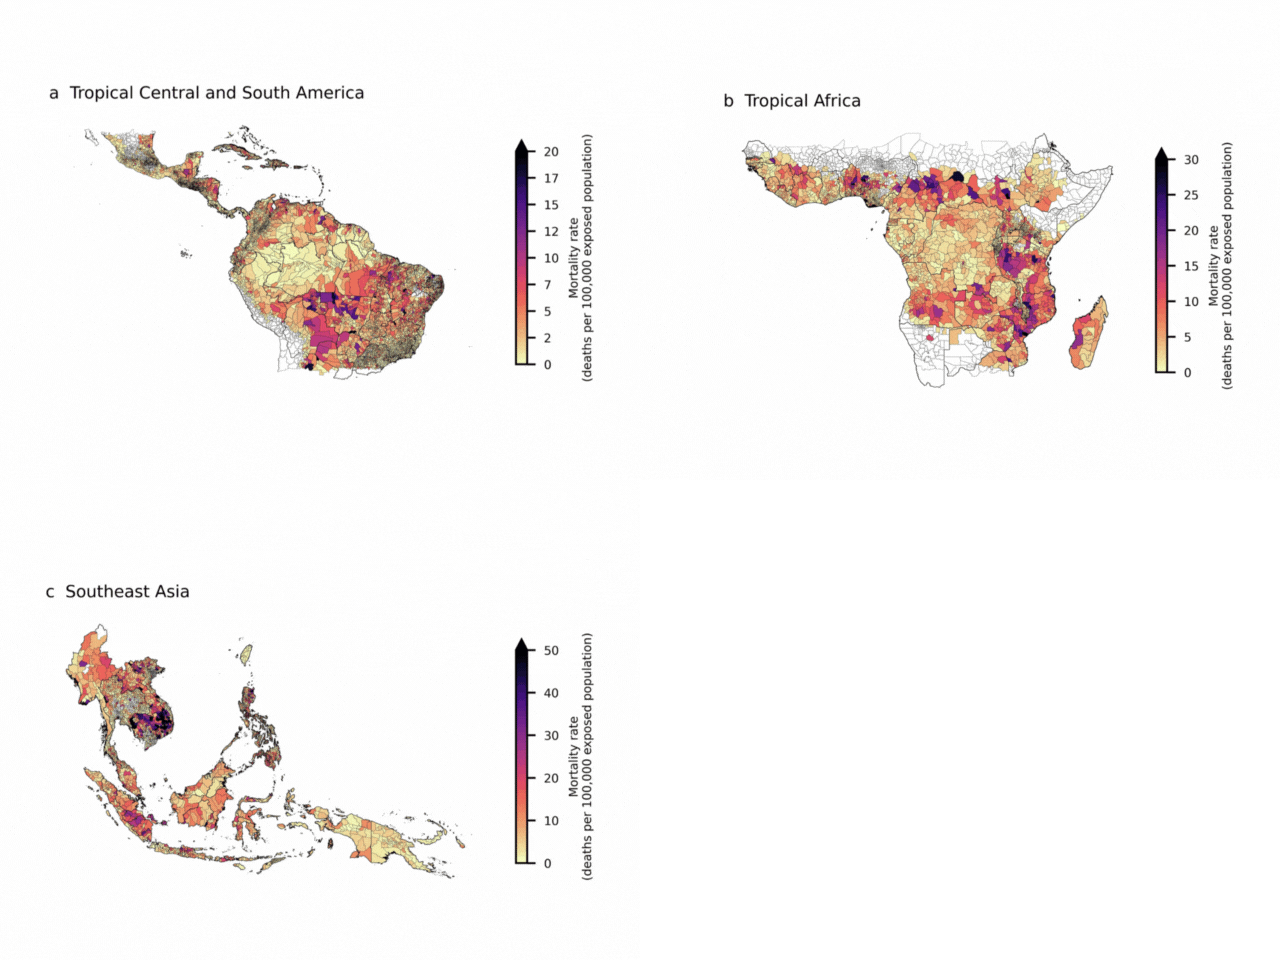
Animated map showing heat-related mortality rates linked to deforestation across Tropical Central and South America, with darker colors representing higher deaths per 100,000 people.
The maps show regions of Tropical Central and South America (a), Tropical Africa (b), and Southeast Asia (c). Colours show number of deaths per year per 100,000 people located in areas of forest loss (central estimate), aggregated by second-level administration divisions. Boundaries for second-level administration divisions are from GADM (https://gadm.org/index.html).

When we hear about deforestation, many of us think first about disappearing wildlife, endangered species, or the loss of carbon storage that slows climate change. All of that is true, but there’s another hidden danger. Cutting down tropical forests hurts our planet’s biodiversity and directly affects human health. New research shows that losing forests makes people hotter, sicker, and in many cases, more likely to die from extreme heat.

What the Study Found

A recent study published in Nature Climate Change looked at forest loss across the tropics between 2001 and 2020. The researchers found that when forests are cleared, the land surface warms up quickly. On average, deforested areas became almost 0.5 °C hotter than places that kept their trees.

That may not sound like much, but for people living in already hot, humid places, even small increases can push temperatures past safe limits. The study estimated that about 345 million people have been exposed to this extra warming caused by deforestation. That’s nearly the size of the entire U.S. population.

The Human Toll

The warming from deforestation is deadly. According to the study, deforestation is linked to about 28,000 extra heat-related deaths each year (Reddington et al., 2025). These deaths happen because the body can only handle so much heat before heart, lung, or kidney problems set in.

Some of the hardest-hit regions include:

  • Indonesia, Vietnam, and Malaysia, where heat deaths per 100,000 people are among the highest in the world.

  • Nigeria and the Democratic Republic of Congo, which also face significant impacts.

  • Southeast Asia overall, which accounts for more than half of all the deaths linked to deforestation-related heat.

In these countries, outdoor workers, such as farmers and construction workers, are especially vulnerable.

Why the Tropics Are Vulnerable

The tropics, regions close to the equator, are home to over 3.5 billion people. Many of these communities depend on outdoor work for their livelihoods. When forests are cut, not only does the land heat up, but shade disappears too. That makes outdoor work far more dangerous.

Health care access also plays a big role. In many tropical nations, hospitals and clinics are already under pressure, and people may not have reliable access to air conditioning, cooling centers, or emergency care. This limited ability to adapt means heat has a bigger impact on vulnerable groups, such as children, older adults, and outdoor workers.

Other Hidden Dangers

Heat isn’t the only risk linked to cutting forests. Deforestation also leads to:

  • Air pollution from fires: When forests are burned, smoke can spread across entire regions. In past years, haze from Indonesian forest fires exposed tens of millions of people to unsafe air, leading to thousands of premature deaths.

  • Spread of diseases: Clearing forests can increase the spread of diseases like malaria. In some places, standing water left after logging creates ideal breeding grounds for mosquitoes.

Together, these risks make deforestation not only an environmental problem but also a serious public health issue.

What Can Be Done

The good news is that protecting forests can prevent many of these heat-related deaths. Keeping trees standing provides shade, keeps local areas cooler, and reduces harmful smoke. On a larger scale, forests act as a buffer against climate change by storing carbon and releasing moisture into the air.

Steps that can help include:

  • Stronger protections for tropical forests through laws and enforcement.

  • Community-led conservation that involves local and Indigenous groups who know the land best.

  • Investment in health systems and cooling strategies to protect people who already live in areas affected by deforestation.

  • Global cooperation to reduce demand for products linked to deforestation, such as unsustainable palm oil, soy, and beef.

These actions can save thousands of lives each year.

Summing Up

The study’s message is clear: tropical forests aren’t just “carbon sinks” or wildlife havens. They are lifelines for millions of people. Losing them raises local temperatures, increases the risk of deadly heat, and harms human health in ways many of us never considered.

By protecting tropical forests, we preserve ecosystems while protecting people. Safeguarding these forests is a direct investment in healthier, safer communities around the world.


Source: Reddington, C. L., Smith, C., Butt, E. W., Baker, J. C. A., Oliveira, B. F. A., Yamba, E. I., & Spracklen, D. V. (2025). Tropical deforestation is associated with considerable heat-related mortality. Nature Climate Change. Advance online publication. https://doi.org/10.1038/s41558-025-02411-0

Will Climate Change Change Our Rainbows?

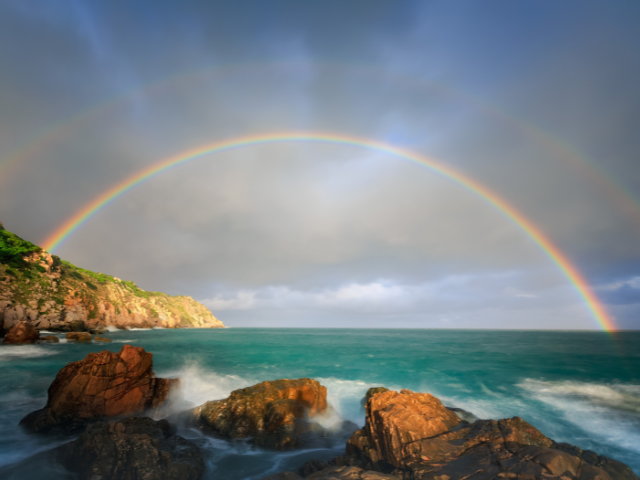
A vivid rainbow arcs over the ocean with rocky cliffs in the foreground, under a cloudy sky.
A double rainbow stretches across the sky above a rocky coastline, showing the beauty and fragility of nature.

Rainbows are a universal symbol of hope, beauty, and wonder. They stop us in our tracks after a rainstorm and remind us of nature’s magic. But here’s a question we might not have asked before: What if climate change changes how often we see them?

For the first time, scientists have studied how global warming could reshape the distribution of rainbows around the world. The study, published in Global Environmental Change, is the first global effort to map rainbow distribution and explore how climate change may alter it (Carlson et al., 2022).

Purpose of the Study

Most climate change research looks at tangible impacts, such as rising seas, stronger storms, heatwaves, droughts, and wildfires. These are serious and urgent threats. But climate change is also transforming experiences in nature that are less obvious but still deeply meaningful to people.

This study focused on what scientists call cultural ecosystem services, the non-material benefits nature provides. These include inspiration, identity, and a sense of wonder. Rainbows fall into this category. The researchers wanted to answer a simple but profound question: How will climate change affect our chances of seeing a rainbow?

How the Study Was Conducted

To find out, the team gathered a unique dataset. They analyzed 7,094 geotagged rainbow photographs uploaded to Flickr between 2004 and 2013. These photos provided evidence of when and where rainbows appeared.

Using this information, the researchers built a model that predicted rainbow occurrence based on three main factors:

  • Sun angle (the position of the sun in the sky).

  • Cloud cover (whether clouds block sunlight).

  • Liquid precipitation (rain, not snow).

They then tested this model against climate projections for the year 2100 using three scenarios: low, moderate, and high emissions. This allowed them to estimate how rainbow sightings might change in the future.

Key Statistics and Findings

The results revealed some fascinating numbers:

  • 117 ± 71 rainbow-days per year: On average, each land location today experiences this many days with at least one rainbow.

  • 4.0–4.9% increase by 2100: Overall, climate change is projected to slightly increase rainbow-days worldwide.

  • 21–34% of land areas will lose rainbow-days, while 66–79% of land areas will gain them.

  • Regional losses are projected in the Mediterranean, Brazil, southern Africa, and southern Australia.

  • Regional gains are expected in Alaska, northern Europe (e.g., Norway), the Tibetan Plateau, Korea, Japan, and eastern Borneo.

  • The model had 86% accuracy overall, with 75% accuracy in predicting rainbows (Carlson et al., 2022).

In other words, while the planet as a whole may see more rainbows, the distribution will shift. Some regions may lose rainbow opportunities, while others gain them.

Why These Results Matter

On the surface, a change in rainbow frequency may seem trivial compared to rising seas or food shortages. But the implications go deeper.

Rainbows carry cultural meaning. Across societies, they symbolize hope, spirituality, peace, and connection. A decline in rainbow sightings in certain regions could weaken traditions and shared experiences tied to them.

Human wellbeing is linked to nature. Research shows that spending time in nature improves mental health and happiness. Rainbows, as brief and beautiful events, strengthen those connections.

Losses will be uneven. Some of the areas projected to lose rainbow-days, such as the Mediterranean and Brazil, are home to large populations. Meanwhile, many of the regions projected to gain rainbow-days, such as northern latitudes and high mountain areas, have fewer people. This means fewer communities will benefit from the increases.

By studying rainbows, the researchers remind us that climate change affects more than just physical dangers. It also shapes the beauty and meaning we find in our surroundings.

The Bottom Line

Climate change isn’t only about floods, storms, and heat. It also changes the beauty we see in the sky. Rainbows may become more common in some places, but less so in others. And while the net global number of rainbow-days may rise, the loss in culturally rich and populated areas could carry emotional and social costs.

The message is clear: protecting the environment means more than ensuring survival. It also means safeguarding the inspirational wonders of nature that make life richer, from the birds we hear at dawn to the rainbows that appear after a storm.

If we act to reduce emissions and protect our climate, we’re not only preventing disasters, we are protecting the everyday magic that reminds us why the Earth is worth fighting for.


Source: Carlson, K. M., Mora, C., Xu, J., Setter, R. O., Harangody, M., Franklin, E. C., Kantar, M. B., Lucas, M., Menzo, Z. M., Spirandelli, D., Schanzenbach, D., Warr, C. C., Wong, A. E., & Businger, S. (2022). Global rainbow distribution under current and future climates. Global Environmental Change, 77, 102604. https://linkinghub.elsevier.com/retrieve/pii/S095937802200142X

When Disaster Strikes, So Do the Lies: How Misinformation Makes Weather Emergencies Worse

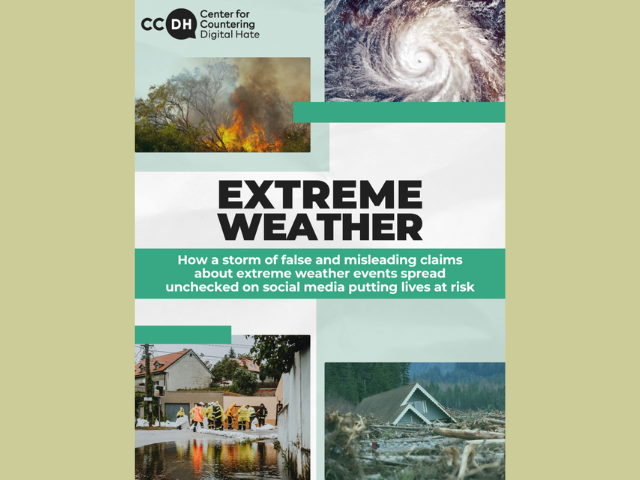
Cover of the CCDH report titled “Extreme Weather,” featuring images of a wildfire, hurricane, flood response team, and destroyed homes, with a subtitle warning about the spread of false climate information on social media.
Cover of Extreme Weather, a 2025 report from the Center for Countering Digital Hate, examining how social media platforms allow climate misinformation to spread during natural disasters — putting lives at risk. Source: Center for Countering Digital Hate, 2025

When deadly floods swept through Texas during the July 4th weekend of 2025, families searched for help and answers. But instead of facts, many found dangerous lies online — like claims that the government had used “weather weapons” to cause the disaster.

It sounds far-fetched, but these ideas aren’t just fringe conspiracy theories anymore. They’re reaching millions of people, right when those people need trustworthy information the most. In moments when accurate updates can save lives, false claims on social media can confuse, scare, and even cause harm — and that’s exactly what’s happening on platforms like X, YouTube, and Facebook.

What’s Happening?

A new report from the Center for Countering Digital Hate (CCDH) found that false claims about disasters like floods, wildfires, and hurricanes are spreading quickly across social media. The researchers reviewed 300 of the most-liked misleading posts from April 2023 to April 2025.

Here’s what they discovered:

  • These posts gained over 221 million views.

  • Nearly all went unlabeled and unchallenged — no fact-checks, no warnings, no corrections.

  • Some of the most extreme lies — like the idea that natural disasters were caused by “weather weapons” — were given huge platforms, even after real tragedies.

One of the most troubling examples came from conspiracy theorist Alex Jones, who claimed the Texas floods were caused by government interference. His posts weren’t hidden or flagged. They were amplified.

Who’s Behind It?

It turns out that many of these misleading posts came from verified users. On Twitter, that blue checkmark, once meant to help people spot reliable voices, is now, on X, being sold and used by those spreading misinformation.

  • 88% of the false posts on X came from verified users.
  • 73% on YouTube, and 64% on Meta (Facebook and Instagram).

One of the most high-profile figures in the study is Alex Jones, a far-right media personality and conspiracy theorist best known for his website InfoWars. Jones has promoted numerous false claims over the years — including that the 2012 Sandy Hook school shooting was a hoax. For these and other violations of platform policies on hate speech, harassment, and misinformation, he was banned from Facebook, Instagram, YouTube, and Twitter between 2018 and 2020.

However, Jones returned to X (formerly Twitter) after the platform reinstated several previously banned accounts in 2023. During the LA wildfires in 2025, Jones used his X account to spread false claims that FEMA was confiscating food and that the fires were part of a “globalist plot.” His wildfire-related posts received over 408 million views — more than FEMA and 10 major news outlets combined during that period.

Even when banned users like Jones couldn’t post directly on some platforms, their false messages lived on. Others reposted their claims or created content that echoed their talking points. On YouTube, for example, 1 in 3 misleading videos led to more misleading videos through the “Up Next” panel.

Why It’s Dangerous

It’s easy to think, “People won’t believe that stuff.” But the truth is, misinformation can cause real harm — especially during emergencies.

  • Some victims avoid seeking aid, believing false claims that disaster relief is only given to certain groups.

  • First responders have been threatened after lies spread about their efforts.

  • A man in Oklahoma vandalized a weather radar system, thinking it was part of a weather-control conspiracy.

And the consequences don’t stop there. A cloud seeding company received over 100 death threats due to false claims linking it to the floods.

How Big Is the Problem?

The reach of misinformation is staggering.

  • Alex Jones’ posts about the LA wildfires alone received 408 million views on X. That’s more than FEMA and 10 major news outlets combined during the same period.

  • In the week following the Texas floods, false posts blaming cloud seeding or climate hoaxes racked up 8.4 million views — without a single fact-check.

These lies are spreading faster than the truth. That’s a big problem.

What Needs to Change

We need to expect more from social media platforms. Here’s what the CCDH report found:

  • Less than 2% of false posts were labeled or fact-checked.

  • Platforms are still profiting — through ads, subscriptions, and increased engagement — even when the content is dangerous.

That means the current system rewards outrage and falsehoods, not truth. And when disaster strikes, that business model puts people at risk.

What You Can Do

We don’t need to wait for platforms to act. Each of us has a role to play in slowing the spread of dangerous misinformation.

Here are a few simple actions we can take:

  • Follow trusted sources like FEMA, your local emergency services, and reliable news outlets.

  • Think before sharing: If something sounds too wild to be true, double-check it first.

  • Report harmful posts that spread misinformation during emergencies.

Collectively, taking these small steps helps us help our communities stay informed and safe.

Summing Up

The next hurricane, wildfire, or flood isn’t a matter of if — it’s when. And in those crucial hours, the difference between truth and lies could mean life or death.

That’s why it’s so important to demand better from platforms — and do our part to protect each other. Let’s make sure the next time disaster strikes, facts come first.


Source: Center for Countering Digital Hate. (2025). Extreme Weather: How social media platforms profit from climate denial and misinformation during disasters. https://counterhate.com/research/extreme-weather-false-claims/